Utilidata
Grid-edge AI made legible to the people who operate the world's power infrastructure.
energy · data-visualization · enterprise-ux · multi-year
Utilidata had built something genuinely novel: hardware-based AI running at the grid edge, classifying electric power waveforms at the meter, right where electricity enters a home or business. The technology could see things utilities had never seen before: real-time load patterns, distributed energy resource adoption, grid stress signals emerging at neighborhood scale. The problem wasn't the technology. The problem was making it legible.
The Problem
Utilidata had built something genuinely novel: hardware-based AI running at the grid edge, classifying and interpreting electric power waveforms at the meter, right where electricity enters a home or business. The technology could see things utilities had never been able to see before: real-time load patterns, distributed energy resource adoption, grid stress signals emerging at the neighborhood level.
Utilities are not software companies. They move on long time horizons, operate under heavy regulatory constraint, and make decisions by committee across operations, compliance, and innovation teams — each with different languages, different priorities, and different thresholds for risk. Selling a new AI platform into that environment required more than a good product. It required a story the market could follow, and a tool that could tell it before the full deployment scale existed to prove it.
 // utilidata · the problem space · making grid-edge ai legible to the people who operate it
Starting Point: Understanding the Landscape
The utility sector is one of the more research-resistant domains I've worked in. Access to operators is limited, organizational structures vary significantly across regions and regulatory environments, and the tools utilities actually use are often bespoke, internally maintained systems that no one outside the organization has ever seen.
We started with stakeholder mapping, secondary research on regulatory landscapes, and heuristic reviews of legacy ADMS (Advanced Distribution Management System) patterns. Then we worked through Utilidata's embedded subject-matter experts to pressure-test assumptions and accelerate our understanding.
From there: direct research with operations managers, grid planners, data scientists, and regulatory stakeholders. The personas were more divergent than they appeared on paper. What mattered to a grid planner — investment timing, infrastructure prioritization, long-range capacity — barely overlapped with what kept an operations manager awake: reliability, anomaly detection, minimizing outage risk. Both mattered. The interface had to serve both without collapsing into a compromise that served neither.
 // platform.ui · grid-edge data · utilities think in policy geographies, not grid assets
The Design Problem: Two Products in One
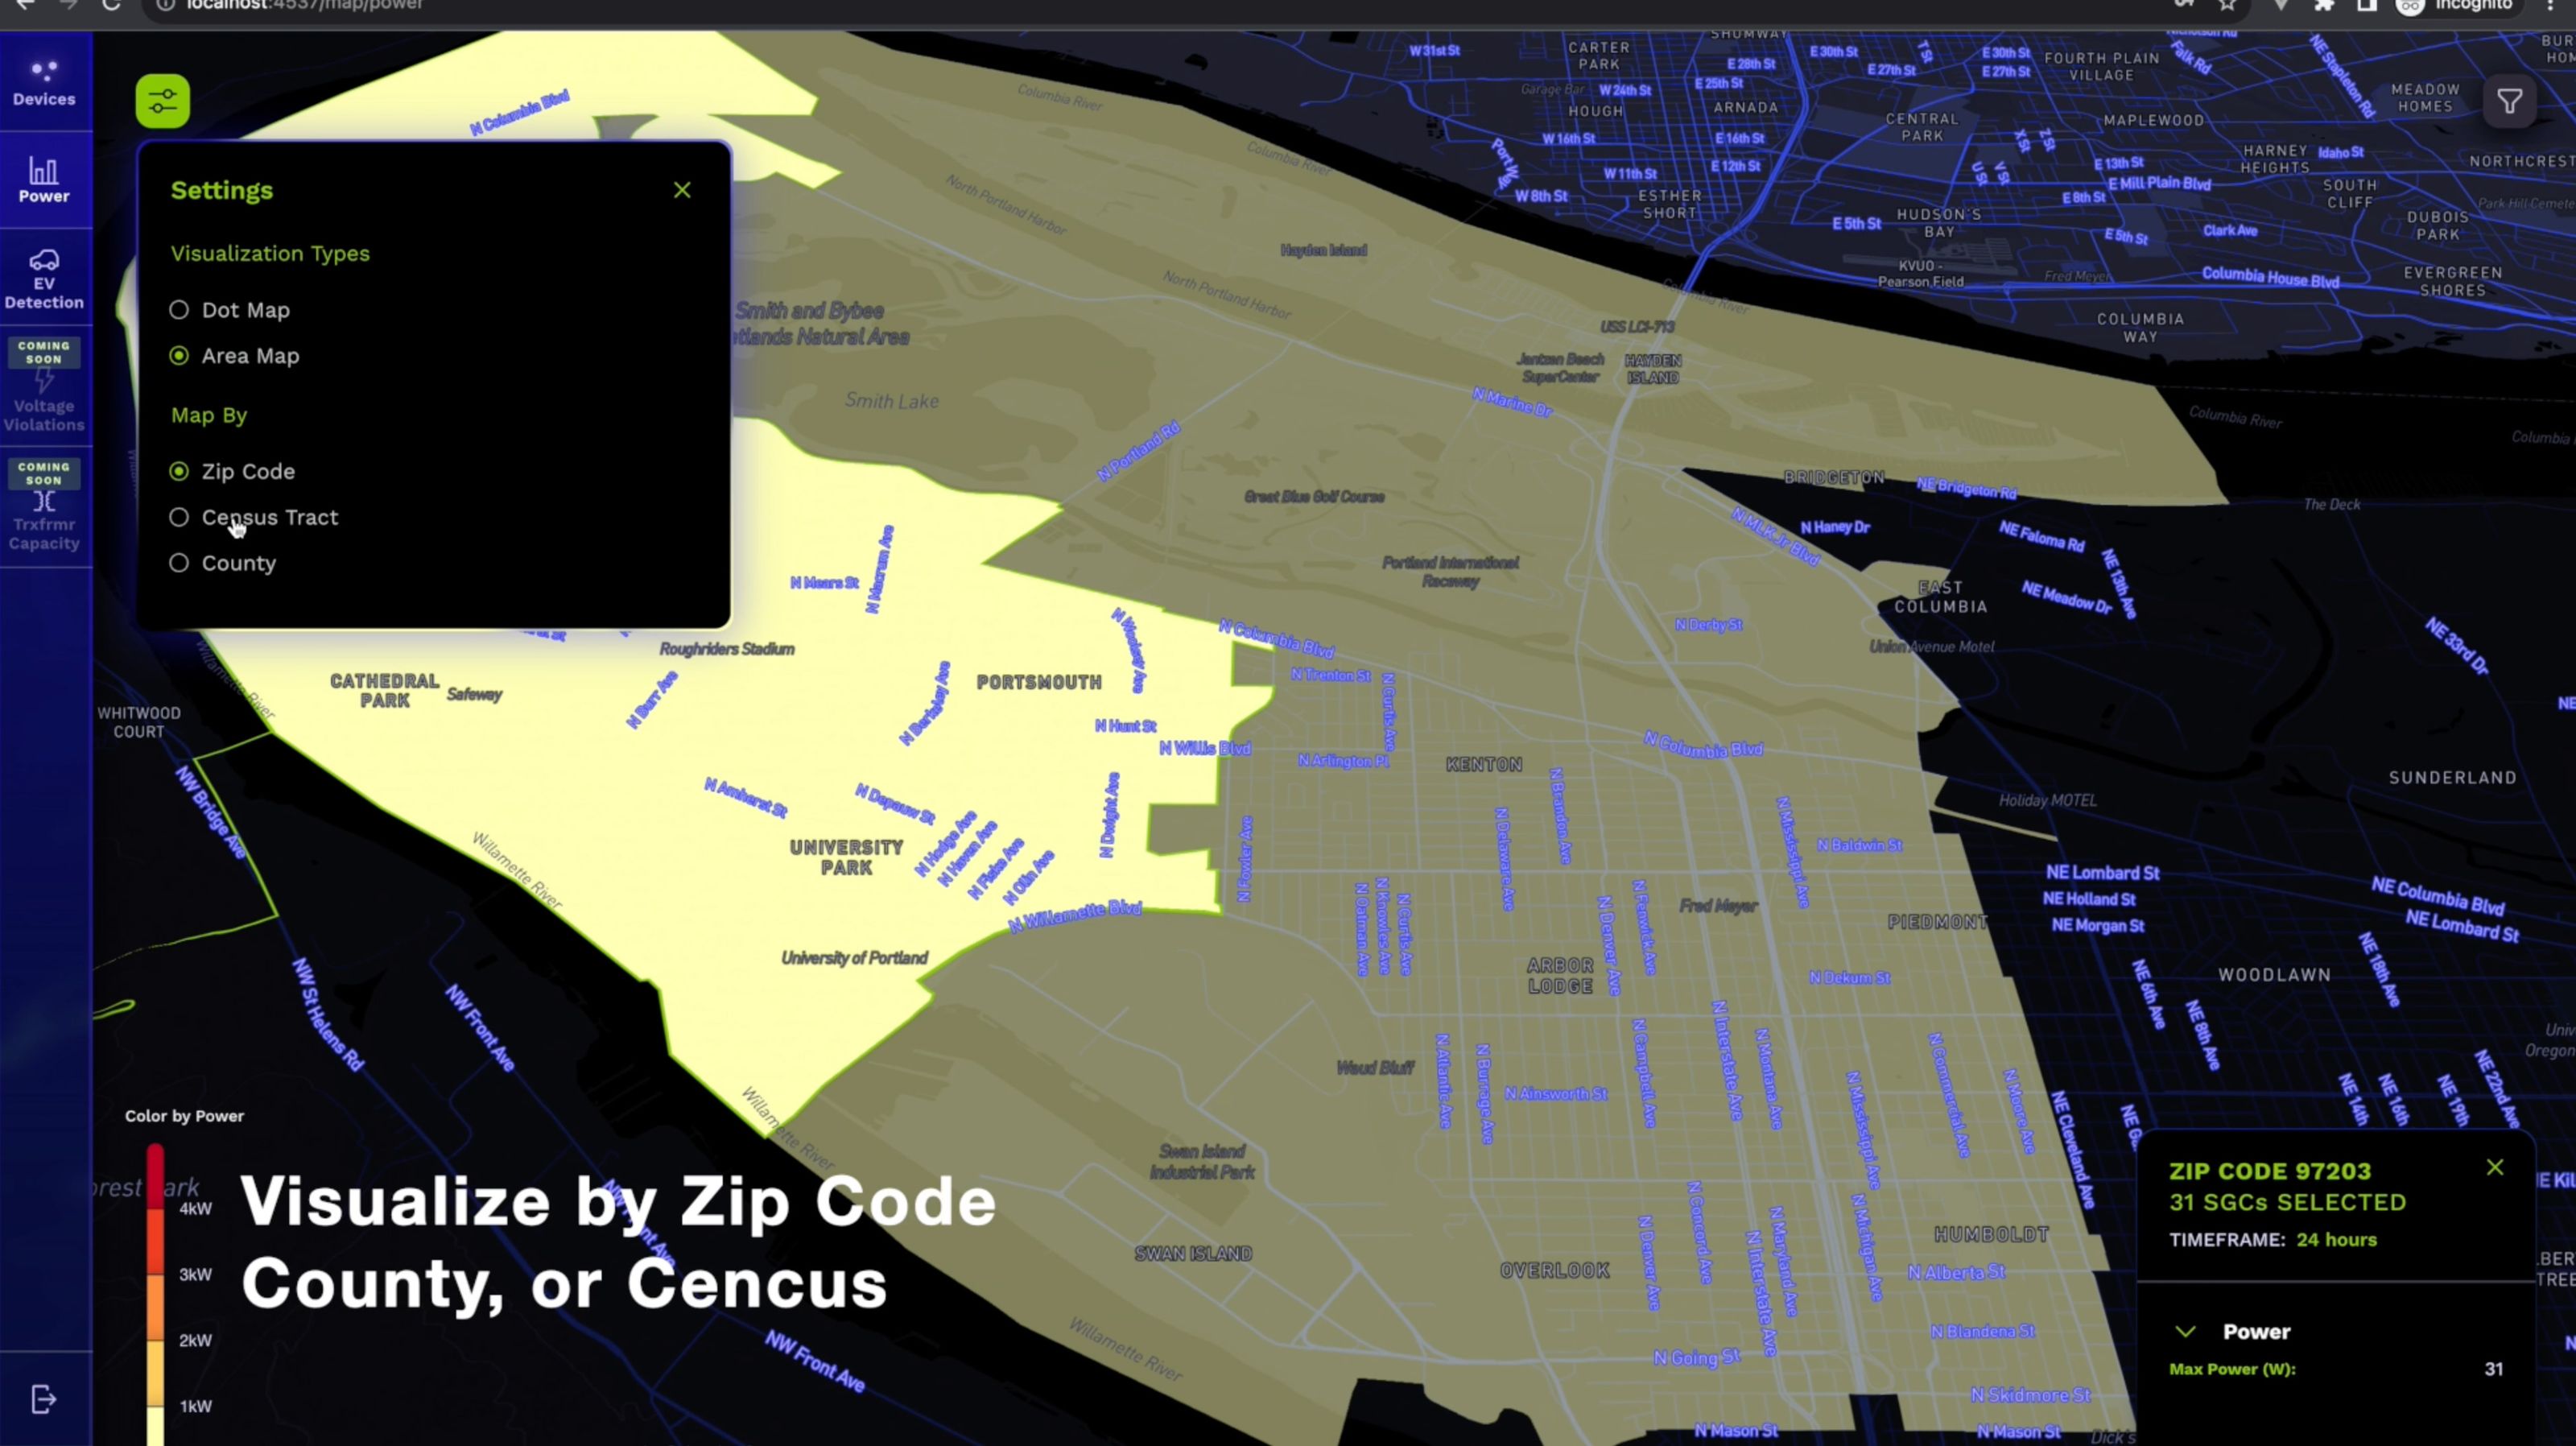
One insight shifted the whole framing of the product: utilities think in policy geographies, not grid assets. When we mapped insights to census tracts and ZIP codes — the same boundaries regulators use, the same units used in public planning — the data became immediately actionable in ways it hadn't been when organized around transformers and feeder lines. That reframe was the conceptual foundation the rest of the design sat on.
We were building two things simultaneously, and they had different masters.
The production platform had to work for real utility operators once device deployment scaled: performant, data-dense, integrated with live APIs, reliable under enterprise conditions. The demo environment had to work right now, for investors, partners, and sales prospects, before that scale existed. It had to show the full movie when we only had a few frames of real footage.
Most products have to choose. We built both: deliberately separated, sharing a design language and component architecture, but running on different data backends. The demo environment ran on a simulated data model we designed specifically for it, with usage patterns, DER adoption rates, and grid stress indicators mapped to real municipal boundaries, calibrated to be illustrative without being fictional.
That distinction — illustrative, not fictional — mattered for credibility. When we showed the platform to utility executives, the data had to feel like their world.
The Interface
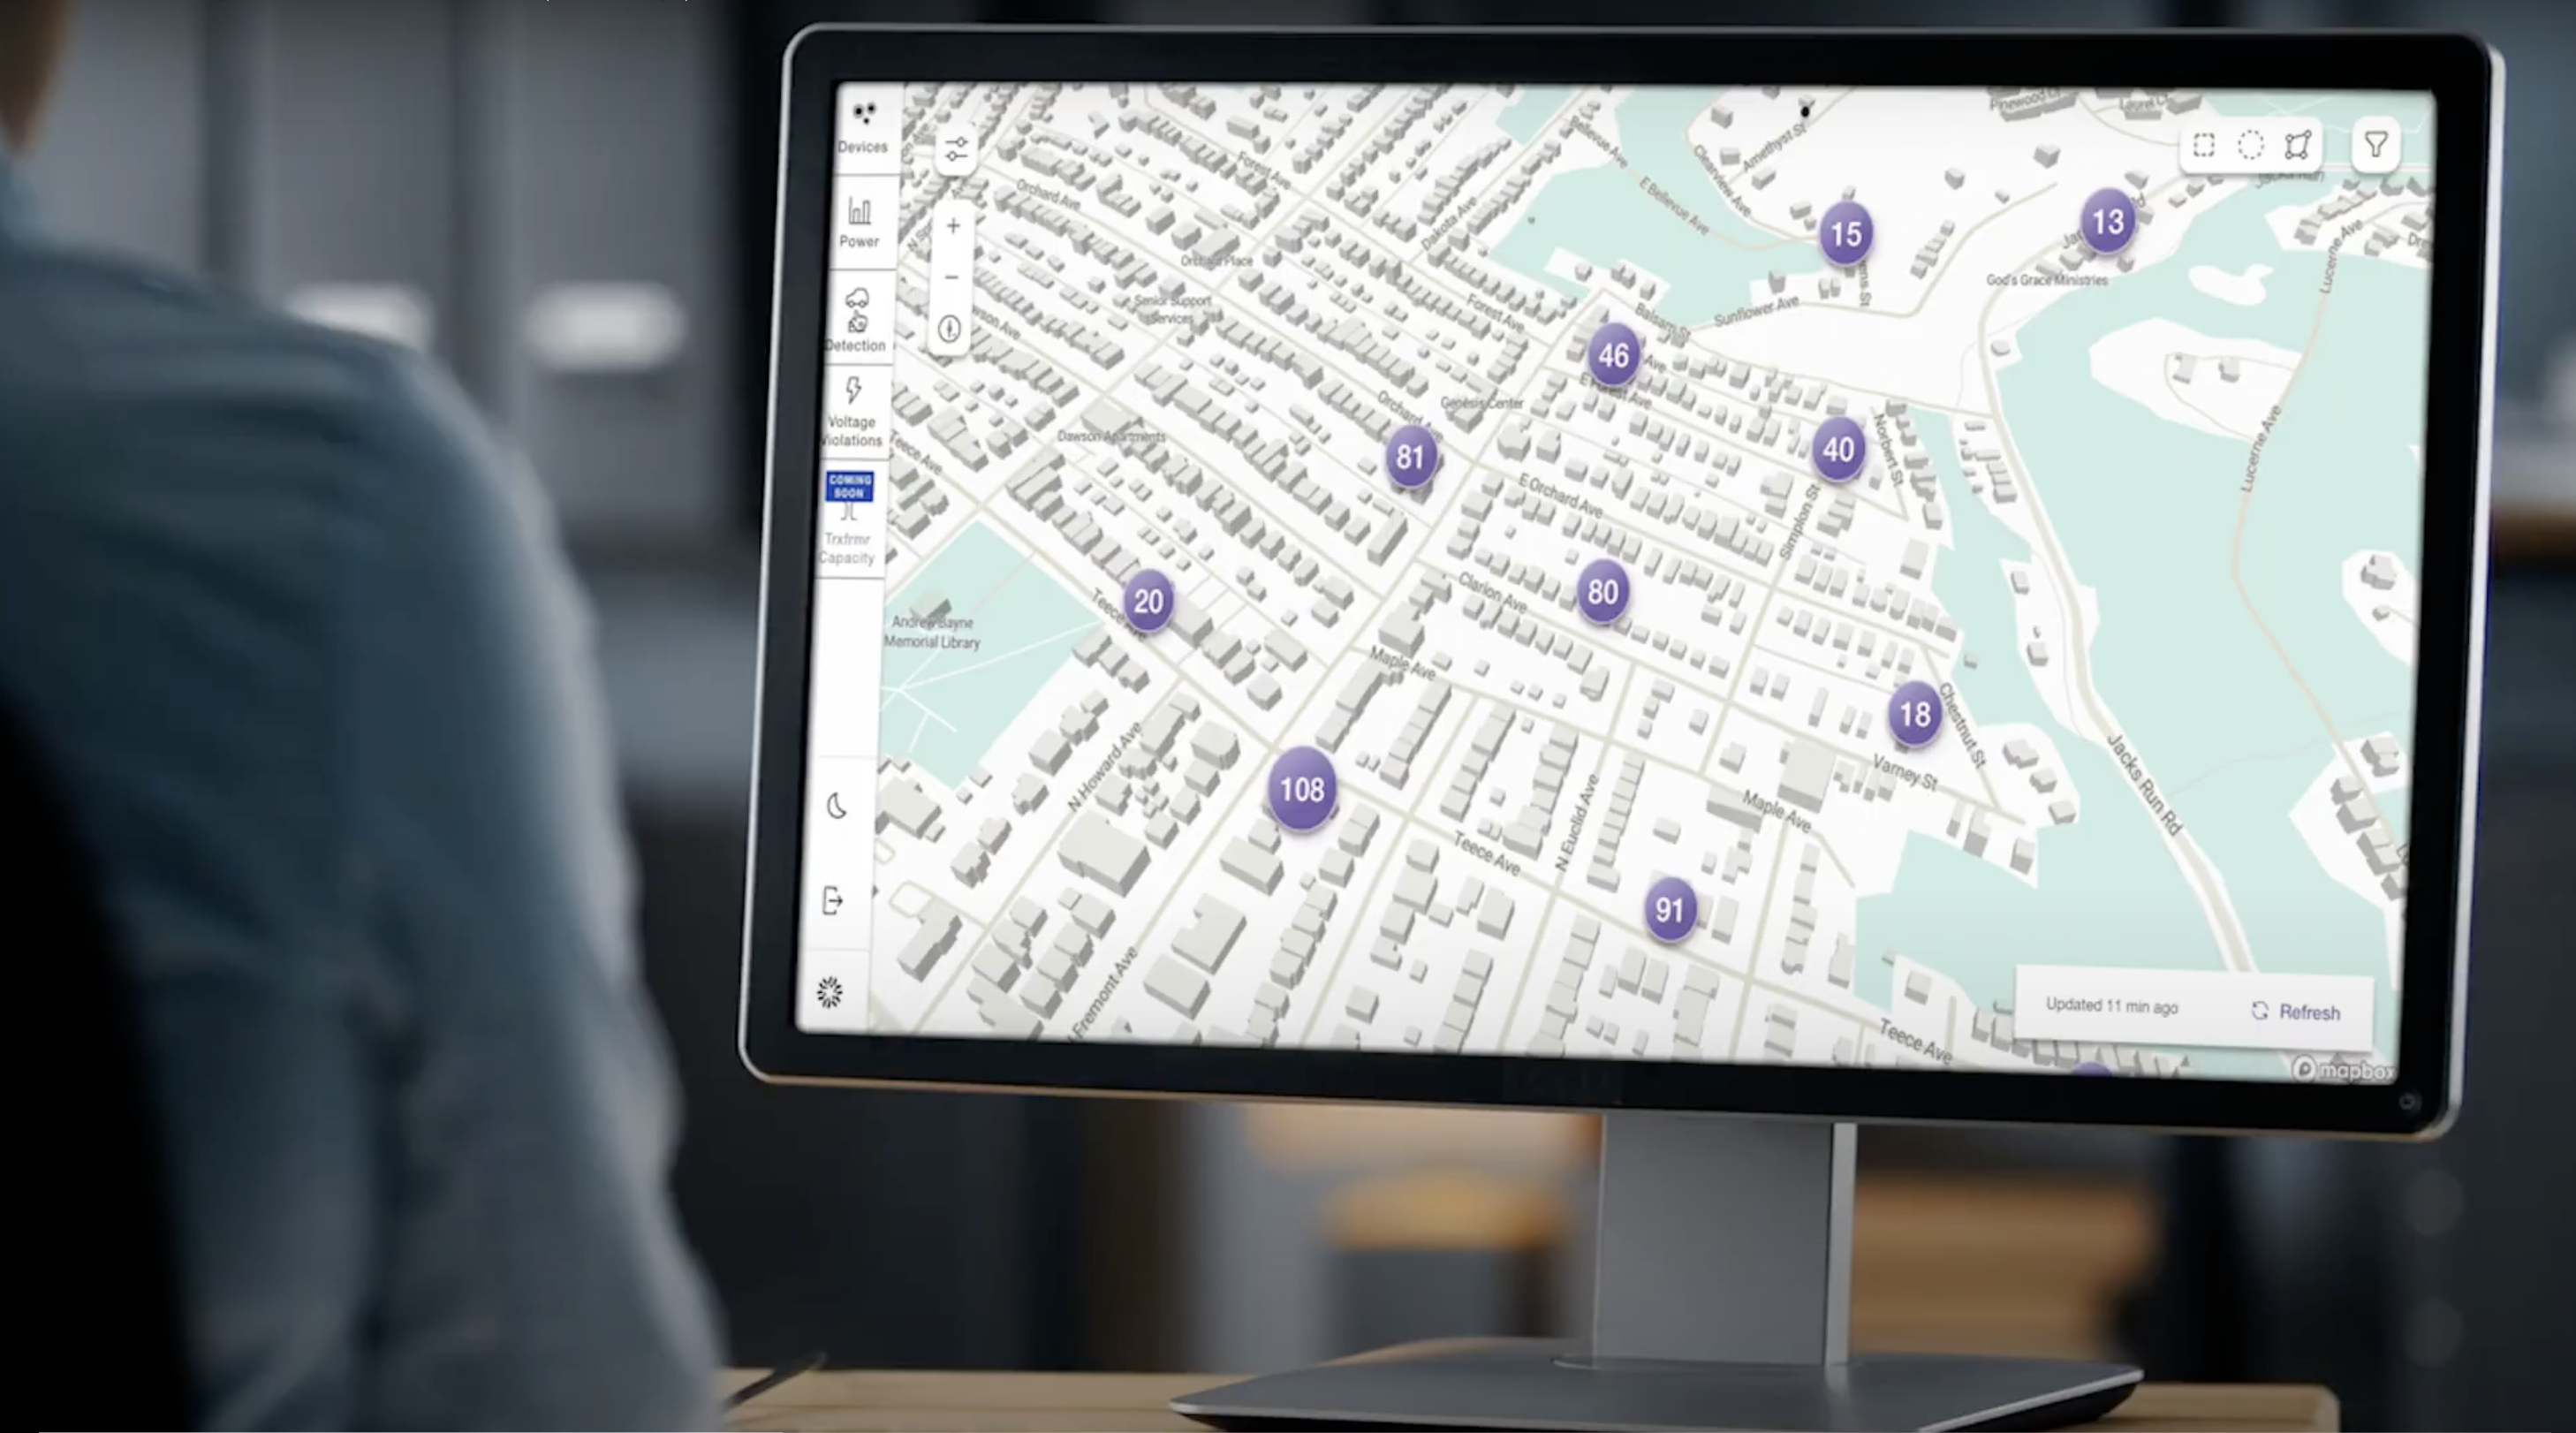
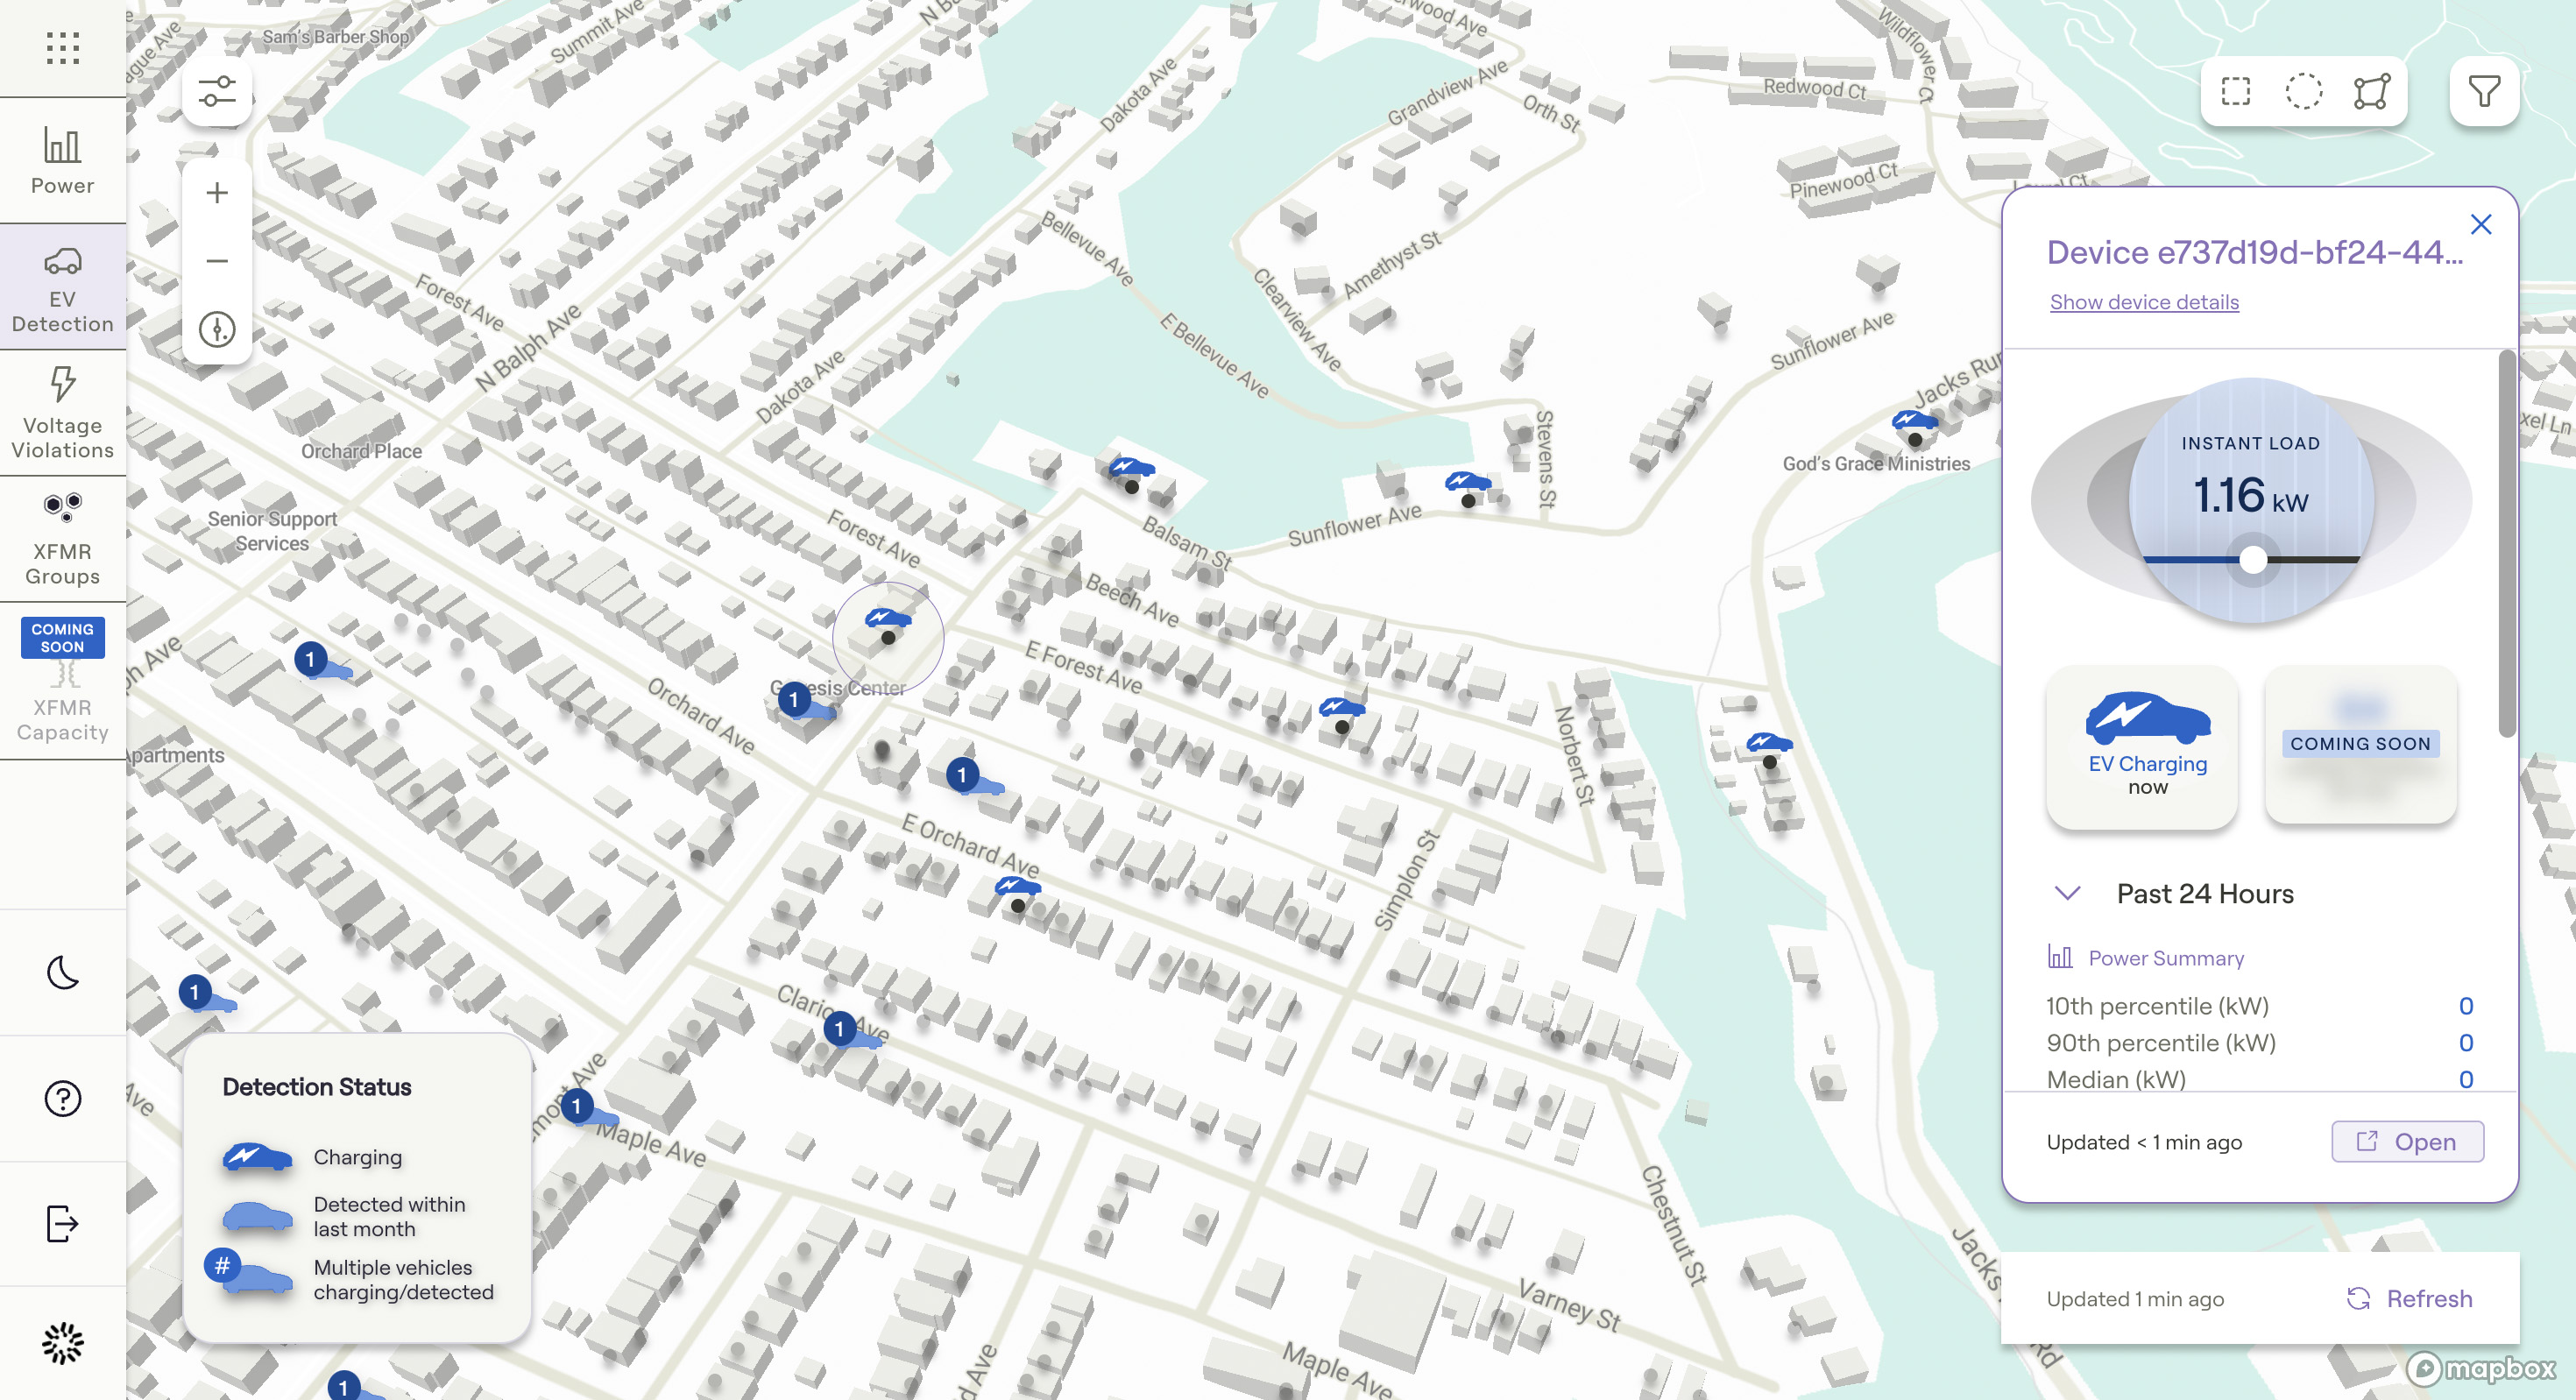
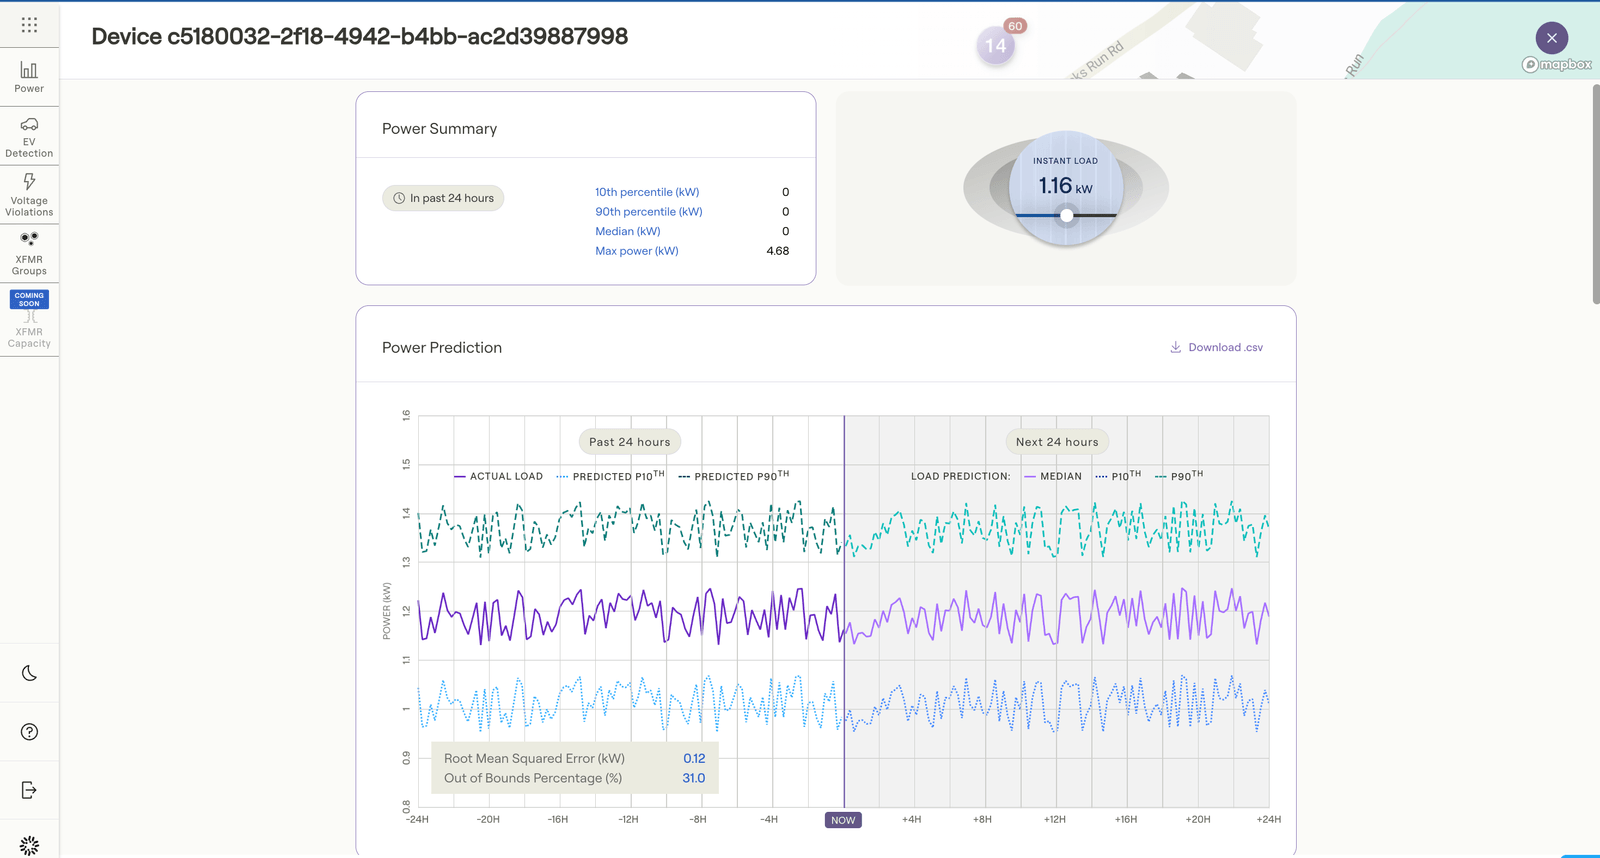
The core product was a map-first web application: a deliberate choice for a domain where geography is everything. Insights layered onto population and policy boundaries — heat maps of usage spikes, DER adoption rates (solar PV, EV chargers, batteries, heat pumps), potential reliability risks surfaced at neighborhood scale before they became outage events.
The information architecture was designed for multi-monitor enterprise workflows, where the platform would run alongside other tools, not replace them. Navigation optimized for side-by-side usage. Density calibrated for users comfortable reading a lot of data and impatient with anything that made them click to find it.
The technical architecture — React and Mapbox — was chosen for performance, responsiveness, and shareability. The front end was engineered from the start with a clear separation between simulated and live data, so the migration from demo to production wouldn't require a redesign. We were building infrastructure, not just screens.
Stakeholder Work: Storytelling as a Design Deliverable
A significant portion of my role was work that doesn't show up in a UI file. Facilitating cross-functional working sessions with product, engineering, sales, and executives to converge on value narratives. Positioning the platform as a "capability demonstrator" rather than a promise about future state. Crafting different framings of the same product for operations audiences versus regulatory stakeholders versus investors.
This is the design work that unlocks everything else. If the internal team doesn't have a shared language for what the product does and why it matters, the interface can't carry the weight of communicating it externally.
The demo environment was itself a storytelling artifact. We treated it that way in its design: scenario-driven, narrative-sequenced, calibrated to take an executive from unfamiliar territory to genuine comprehension in a single walkthrough.
Outcome
The platform supported strategic outcomes across the engagement: partnership development including work with NVIDIA, capital raises, and the ability to run sales conversations at a level of specificity that hadn't been possible before the demo environment existed.
It also informed a pivot. As market realities sharpened — regulatory complexity, uneven incentives, the slow adoption curves endemic to the utility sector — Utilidata identified a more compelling application of the same core technology in a different vertical. The design primitives we'd built transferred: the data model, the component architecture, the understanding of how to make edge AI legible to enterprise buyers. Octo continued as a design and product partner into the next phase.
That's one of the cleaner signals that the foundational work was right: it survived the pivot.
What I'm Proud Of
The demo environment is what I think about most from this project. Not because it was technically impressive — it was a reasonably standard React app on a simulated dataset. But because of what it represented strategically: the conviction that in regulated, slow-moving markets, a high-fidelity demo is not a shortcut. It's a prerequisite. You cannot wait for the deployment scale to tell the story. You have to build the story first and let the scale catch up.
That argument required convincing people, internally and externally. The design work was a fraction of it. The rest was the kind of stakeholder navigation that doesn't have a clean deliverable — just outcomes, over time.
I also carry the insight about policy geographies everywhere now. When you map your data to the boundaries regulators think in, you stop being a product demo and start being a planning tool. That's a different conversation to be in.
Platform details, client specifics, and funding context available under NDA.
>_ discuss this project →